![Spectrum of [13CII] emission in star-forming region N159W on an image of the Large Magellanic Cloud](/data/SOFIA/docs/sites/default/files/Public/SCI2020_0005.png "Spectrum of [13CII] emission in star-forming region N159W on an image of the Large Magellanic Cloud")
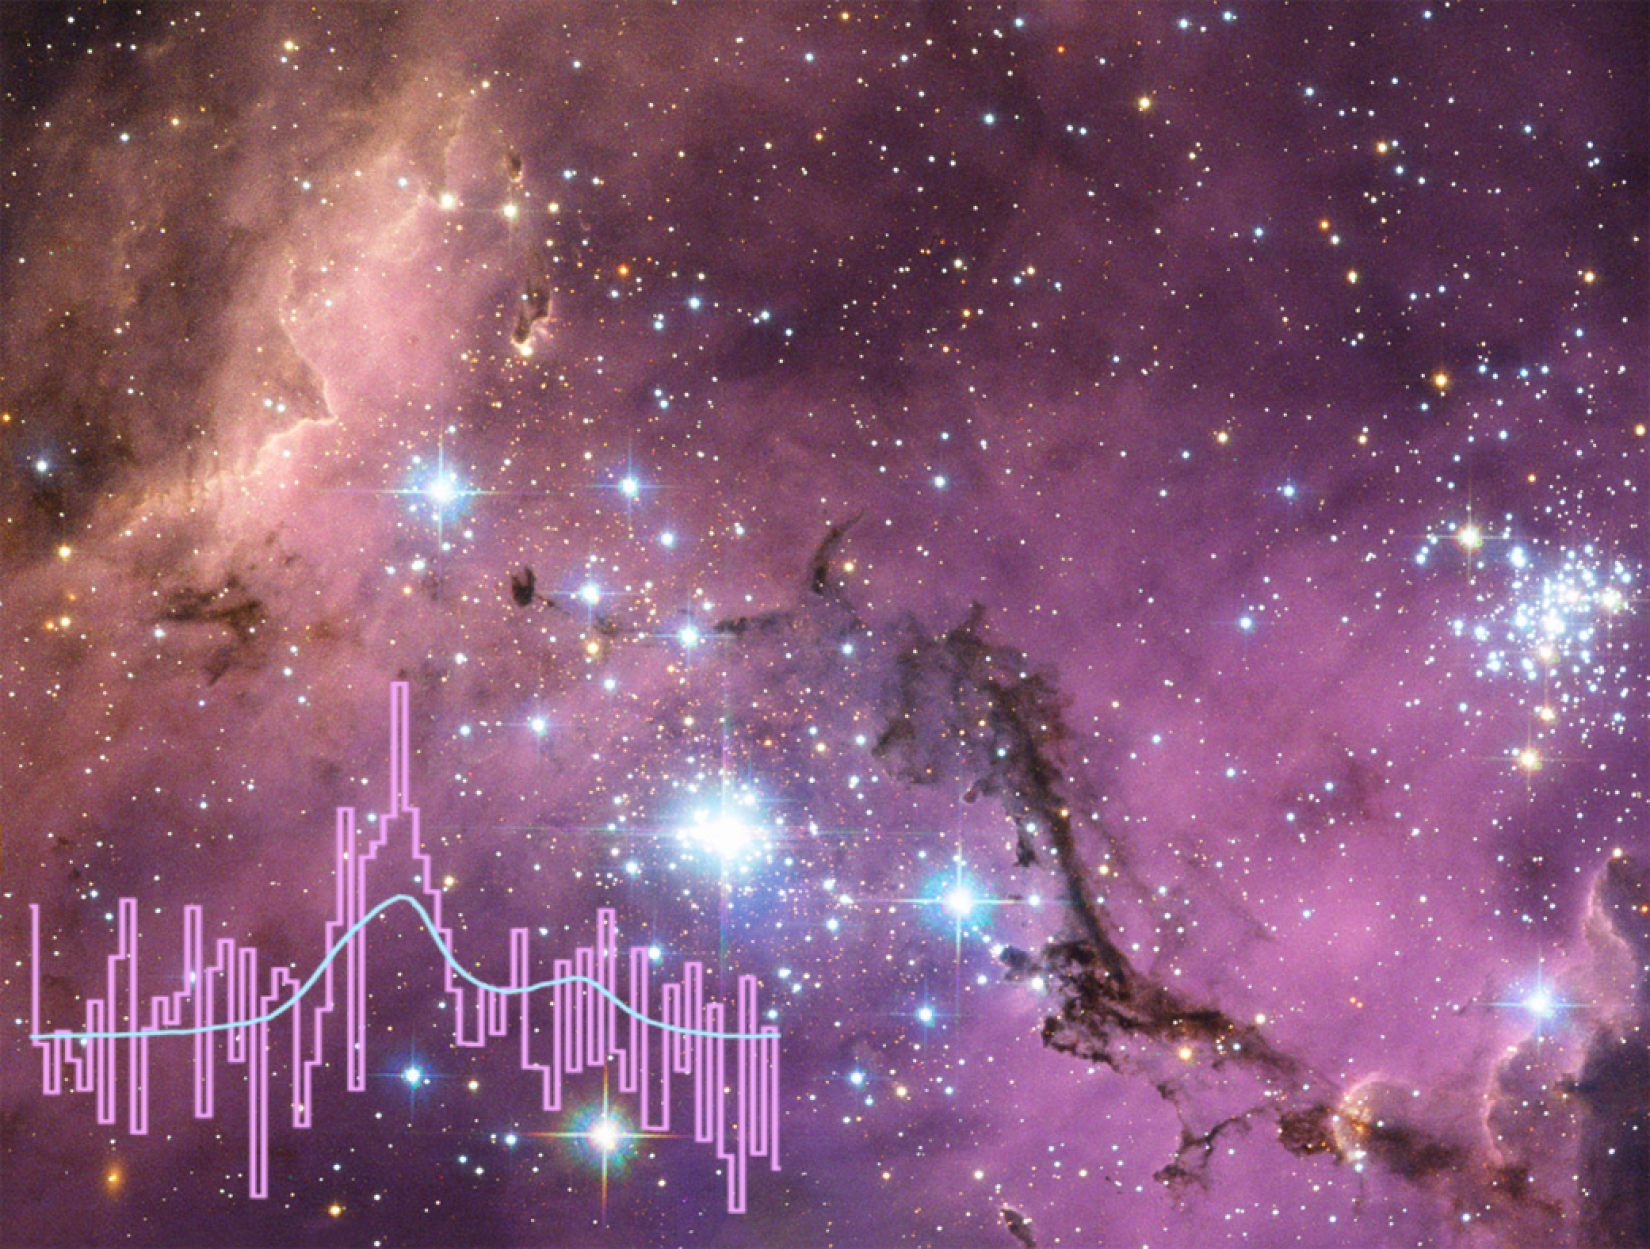
Spectrum (histogram) of [ 13 CII] emission in the star-forming region N159W superposed on an image from Hubble Space Telescope of the Large Magellanic Cloud. The blue curve is the scaled emission that would be expected if the [ 12 CII] emission from the same region were optically thin. The observed intensity of [ 13 CII] is stronger than the scaled emission, indicating that [ 12 CII] is optically thick.
Additional Information
SOFIA Reveals the Complex Nature of a 'Simple' Star Formation Tracer
United States